Amazon Price History Now 365 Days What Shoppers Should Know
Amazon has expanded its price history feature to cover a full 365 days, giving shoppers unprecedented visibility into pricing trends. This update helps buyers spot genuine price drops, avoid fake discounts, and understand how Amazon prices fluctuate over time. Here is everything you need to know about the new 365-day Amazon price history tool.
Amazon has made a big change that every shopper should pay attention to. The company has expanded its Amazon price history feature to cover a full 365 days. This means you can now see how the price of any product has changed over an entire year.
For years, shoppers have relied on limited pricing data when making purchases on Amazon. The old system only showed a few months of price history, which made it hard to spot real deals from fake ones. Now, with a full year of historical pricing data, you have much more power to shop smart and save money.
In this guide, we will walk you through everything you need to know. We will cover how the new feature works, why it matters, and how you can use it to find the best deals online. Whether you are a casual buyer or a serious deal hunter, this update changes the game for you.
Key Takeaways
- 365-Day Tracking: Amazon now shows a full year of price history for products, giving you far more data than before.
- Spot Fake Sales: The extended timeline makes it much easier to catch inflated prices and deceptive discounts.
- Smarter Timing: You can now identify the best times to buy based on a full year of product pricing trends.
- Works With External Tools: Amazon’s built-in graph pairs well with tools like Keepa and CamelCamelCamel for deeper insights.
- More Transparency: The update builds trust and gives shoppers more control over their buying decisions.
📑 Table of Contents
What Is Amazon Price History?
If you have ever wondered why a product seems cheaper today than it was last month, Amazon price history is the answer. It is a visual tool that shows you how the price of a product has changed over time. You can see peaks, drops, and steady trends right on the product page.
The new 365-day version gives you a much longer view. Instead of just a few weeks or months, you can now track product pricing trends for an entire year. This is incredibly useful when you are trying to decide if a current price is actually a good one.
Amazon built this feature to help buyers feel more confident. When you can see the full price fluctuation pattern, you are less likely to fall for fake sales. The Amazon marketplace is huge, and prices change constantly. This tool helps you keep up with all that movement.
The feature also works as a kind of savings tracker. You can look back and see exactly how much a product has cost over time. This is especially helpful for expensive items like electronics, where even a small price fluctuation can mean significant savings.
Why Did Amazon Expand to 365 Days?
Amazon has always been about the customer experience. The decision to extend price monitoring to a full year comes from listening to what shoppers want. People asked for more data, and Amazon delivered.
Here is why this expansion matters so much:
- More Data, Better Decisions: A full year gives you a complete picture of how a product is priced.
- Seasonal Trends: You can now see how prices shift during holidays, back-to-school season, and other key shopping periods.
- Trust Building: Amazon wants shoppers to trust the platform. Showing a full year of data proves they have nothing to hide.
- Staying Competitive: Other retailers and price tracker tools already offered longer histories. Amazon needed to keep up.
The bottom line is simple. Shoppers who track prices save more money. Amazon knows this, and the 365-day window makes the Amazon price tracker experience much more useful for everyone. It also aligns with Amazon’s broader Amazon pricing strategy of building trust through transparency.
When you can see a full year of data, you understand the rhythm of how Amazon prices products. Some items stay stable for months and then drop suddenly. Others fluctuate weekly. The 365-day view captures all of these patterns, giving you an edge in online shopping tips and strategies.
How to Use the New Price History Feature
Using the expanded price history tool is straightforward. You do not need any special skills or extra software to get started. Here is how to make the most of it.
Finding Price History on Any Product Page
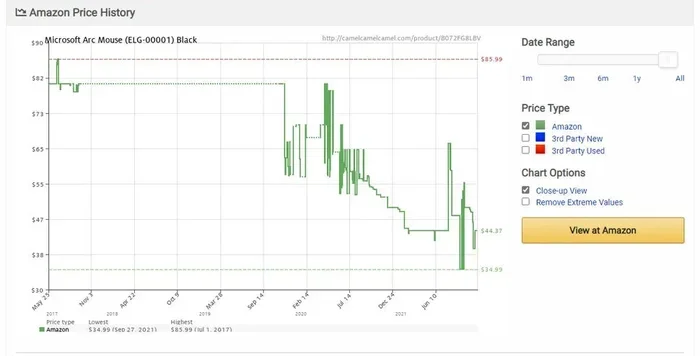
Go to any product page on Amazon. Look for the price section. You will see a small graph icon or a link that says something like “See price history.” Click on it, and a chart will appear showing the price over the last 365 days.
The graph is easy to read. The x-axis shows the timeline, and the y-axis shows the price. You can hover over any point to see the exact price on that date. This makes it simple to spot when a product hit its lowest or highest price in the past year.
For example, if you are looking at a 2tb nvme ssd and want to check its price trend, you can quickly see if today’s price is actually a good deal or if it is just a regular price dressed up as a sale. This kind of retail price comparison is incredibly powerful when shopping for tech gear.
Understanding the Price Graph
The graph uses colors and lines to show different things. A green line might indicate a sale price, while a gray line shows the regular listing price. Some sellers also use different colors to show prices from third-party merchants versus Amazon directly.
Here are a few tips for reading the graph effectively:
- Look for dips: These are the moments when the price dropped below its normal level.
- Watch for spikes: A sudden jump in price often means the seller raised it or restocked at a higher cost.
- Compare the low and high: This tells you the full range of price fluctuation for that product.
- Check the average: Some views show a rolling average that smooths out the daily changes and gives you a clearer trend.
The more you use the graph, the better you will become at reading it quickly. Within a few minutes, you will be able to glance at a chart and know whether now is a good time to buy.
How to Spot Fake Price Drops
One of the biggest reasons the 365-day Amazon price history matters is that it helps you catch fake discounts. Some sellers inflate the original price and then show a huge “discount” that is really just the normal price.
This trick is more common than you might think. The old shorter price history window made it harder to catch. But now, with a full year of data, you can easily see if the “original” price was ever real.
Here is what to look for:
- Check the lowest price in the last 12 months. If the “discounted” price is higher than the lowest recorded price, you are not getting a real deal.
- Look for sudden jumps before the sale. If the price jumped right before a “sale,” the seller may have manipulated the numbers.
- Compare with other tools. Sites like Keepa and CamelCamelCamel offer their own price monitoring data that you can cross-check against Amazon’s graph.
By using the full 365-day view, you protect yourself from deceptive Amazon discounts and make sure every purchase is a smart one. This alone is worth the update, because fake sales waste your money and your time.
Think of the 365-day graph as your personal deal hunting companion. It works silently in the background, giving you the information you need to make confident choices without any extra effort.
Best Tools to Track Amazon Prices
While Amazon’s built-in price history is now much better, many shoppers still use external tools for deeper insights. These tools add extra layers of data that the native feature does not always provide.
Keepa and CamelCamelCamel Compared
Keepa and CamelCamelCamel are the two most popular Amazon price tracker tools. Both offer browser extensions that show you price charts directly on Amazon product pages. Keepa is known for its detailed charts that include Amazon Warehouse deals and third-party seller prices. CamelCamelCamel offers a simpler interface and email alerts for price drops.
Here is a quick comparison:
- Keepa: More detailed charts, email and app alerts, tracks Amazon Warehouse deals, free and paid versions available.
- CamelCamelCamel: Simple and clean interface, email price drop alerts, free to use, easy to set up.
Both tools complement Amazon’s new 365-day feature. They give you even more historical data and alert options. If you are serious about deal hunting, using both together is a powerful combination.
For instance, if you are shopping for a 1tb nvme ssd price india, these tools can show you exactly when the price tends to drop and alert you when it hits your target. This kind of price monitoring can save you a significant amount of money over time. You can also check the biggest NVMe SSD options and track their prices over the year to find the best value.
Using Price Alerts Effectively
Setting up price drop alerts is one of the best ways to use these tools. You pick a product and set your target price. When the price drops to that level, you get an email or notification. This means you do not have to check the graph every day manually.
Combine alerts with the 365-day history, and you have a complete shopping savings system. You know what the price has been, you know what you want to pay, and the tool tells you when to buy.
Tips for Saving Money on Amazon
Knowing the price history is only half the battle. You also need a strategy for when to buy. Here are some practical tips that can help you maximize your shopping savings.
Timing Your Purchases
The best time to buy on Amazon often depends on the product category. Electronics tend to drop in price during major sales events like Prime Day and Black Friday. However, the 365-day price history lets you see these patterns for any product, not just during big sale events.
Here are some timing strategies that work well:
- Watch for restocking dips: When a product is restocked after selling out, the price sometimes drops temporarily.
- Buy during off-peak seasons: For example, buying winter gear in spring often means lower prices.
- Use price alerts: Set up alerts through Keepa or CamelCamelCamel so you get notified when the price hits your target.
- Check the Amazon product page regularly: Sometimes prices drop without any announcement, and the 365-day graph will show you exactly when it happened.
Shopping Smart for Tech Gear
Tech products like storage drives and cameras see a lot of price fluctuation. If you are looking for something like a camera, you can use Amazon’s price history along with tools like the what camera should I buy quiz to make a confident decision. Pair that with price tracking, and you will know you are getting the best value.
Similarly, if you are shopping for storage, you can check the 2TB NVMe SSD price trends alongside the 365-day graph. This way, you buy when the price is right, not just when you feel like it. Checking regional pricing is another smart move. International shoppers can compare local prices with Amazon’s global listings to find the best option.
The key is to combine multiple sources of information. Use Amazon’s price history, external trackers, and smart timing strategies together. This approach gives you the best chance of finding genuine Amazon discounts and avoiding overpaying.
What Shoppers Are Saying
The reaction to the 365-day Amazon price history has been overwhelmingly positive. Shoppers on forums and social media have praised the update. Many say it has already helped them save money by avoiding fake sales and timing their purchases better.
Some users shared their experiences online. One shopper mentioned that they waited three months for a laptop accessory to hit its lowest price of the year. The new 365-day chart made it easy to see when the price finally dropped, and they saved over 30 percent.
Others appreciate the transparency. “I used to feel like Amazon was playing games with prices,” one shopper wrote. “Now I can see exactly what is going on, and I feel much more in control of my shopping savings.”
The feedback shows that shoppers value honesty and data. Amazon’s move to expand the price history to a full year aligns with what buyers want: more information, more control, and more confidence in their purchasing decisions. It is a clear sign that Amazon is listening to its customers and investing in tools that make online shopping better for everyone.
Final Thoughts
The expansion of Amazon price history to 365 days is a win for shoppers. It gives you the tools you need to understand product pricing trends, avoid fake discounts, and time your purchases for the best possible price.
Whether you use Amazon’s built-in graph or pair it with external tools like Keepa and CamelCamelCamel, the result is the same. You become a more informed, more confident buyer. You stop guessing and start shopping smart.
Take some time to explore the new feature on your next Amazon visit. Check the price history of a few products you are considering. You might be surprised by what you find. And the next time you see a “great deal,” you will know exactly whether it truly is one.
The world of online shopping is always changing. But with the right price monitoring tools and a little knowledge, you can always stay ahead. Happy deal hunting, and may your shopping savings grow with every purchase.
Frequently Asked Questions
How do I access Amazon’s price history feature?
Go to any product page on Amazon and look for the price section. You will see a graph icon or a link labeled “See price history.” Click on it, and a chart showing the last 365 days of pricing data will appear. No extra software is needed.
Is Amazon’s price history accurate?
Yes, Amazon’s built-in price history is based on real data from the platform. However, for the most comprehensive view, many shoppers pair it with external tools like Keepa or CamelCamelCamel. These tools sometimes capture additional data points, such as third-party seller prices and warehouse deals.
Can I use the 365-day history on mobile devices?
Yes, the 365-day price history feature is available on both desktop and mobile versions of Amazon. The graph may look slightly different on a smaller screen, but all the same data and functionality are there. You can still hover over points to see specific prices.
How often does Amazon update its price data?
Amazon updates its pricing data in near real-time. The graph reflects changes as they happen on the platform. This means if a seller changes the price, it will show up on the price history chart relatively quickly, giving you the most current picture possible.
Are there any costs to use the price history feature?
No, Amazon’s built-in price history tool is completely free. There is no subscription or extra charge to view the 365-day graph. External tools like Keepa and CamelCamelCamel also offer free versions, though they have premium tiers with additional features.
What should I do if I see a fake price drop?
If the “discounted” price is higher than the lowest recorded price in the last 365 days, it is likely a fake sale. Check the graph carefully before buying. You can also cross-reference with external price tracker tools to confirm the real price. When in doubt, wait and watch for a genuine drop.